折线图
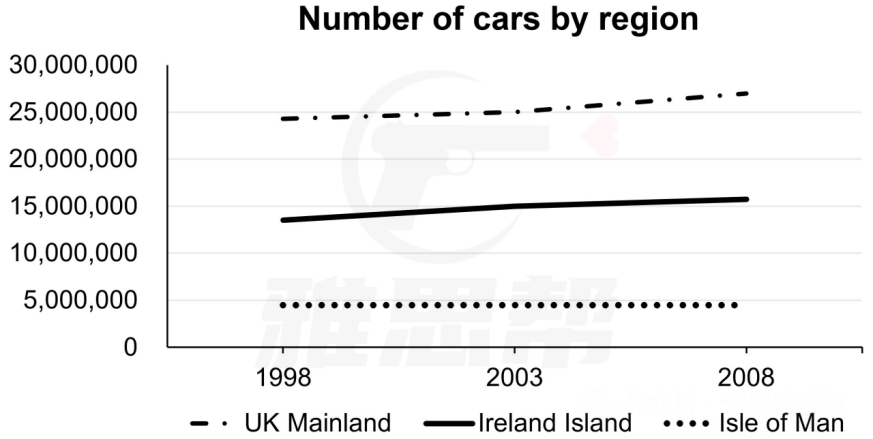
The graph below shows the number of cars in three regions in the UK from 1998 to 2008.
Summarise the information by selecting and reporting the main features, and make comparisons where relevant.

题目来源:2025年5月17日大陆雅思小作文
1、题目大意
下图显示了1998年至2008年英国三个地区的汽车数量。
2、高分范文示例
开始段 - 改写题目+总结
The chart displays changes in car ownership between 1998 and 2008 in three regions of the United Kingdom, namely Mainland UK, the island of Ireland, and the Isle of Man. Overall, Mainland UK had the highest number of cars and experienced the most significant growth over this period, whereas the Isle of Man had the lowest figures.
第一段 - 英国本土
In 1998, Mainland UK had nearly 25 million cars. This was already higher than the combined total of the other two regions. The number of cars on the mainland continued to rise, with growth accelerating particularly between 2003 and 2008. By the end of the period, it had reached approximately 27 million.
第二段 - 其他两个地区
In 1998, the island of Ireland had roughly 14 million cars, which was almost three times the number in the Isle of Man. Over the subsequent decade, this figure rose slowly to just above 15 million by 2008. By contrast, the Isle of Man consistently had the fewest cars, with its total remaining virtually unchanged and below 5 million throughout the period.
必备语料
car ownership 汽车保有量
experienced significant growth 经历了显著增长
the combined total 总和
accelerated notably 明显加速
rose gradually 缓慢上升
remained virtually unchanged 几乎没有变化
the highest figures 最高的数据
the lowest numbers 最低的数据
throughout the period 在整个期间
by contrast 相比之下


