

柱状图+饼图
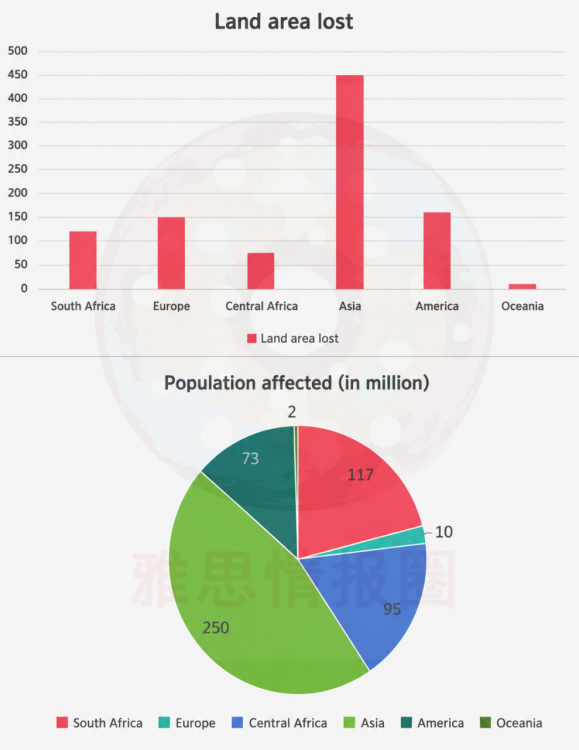
The charts below show the land area lost (thousand km2) per one-metre rise in sea level and the population (in millions) affected per one-metre rise in sea level in the predicted future.
Summarise the information by selecting and reporting the main features, and make comparisons where relevant. Write at least 150 words.
题目来源:2026年8月1日大陆雅思小作文
1
题目大意
下图展示了在预测的未来,海平面每上升一米所损失的陆地面积(单位:千平方公里)以及受影响的人口数量(单位:百万)。
通过筛选和报告主要特征来总结信息,并在相关之处进行比较。
2
高分范文示例
开始段 - 改写题目+总结
The bar chart and pie chart compare the projected land area lost, measured in thousands of square kilometres, and the number of people affected, in millions, across six regions following a one-metre rise in sea level. Overall, Asia is expected to experience by far the greatest impact in terms of both land loss and population affected, whereas Oceania is projected to record the lowest figures. However, the rankings for land loss and affected population do not always correspond, particularly in Europe and South Africa.

第一段 - 柱状图分析
Asia is forecast to lose approximately 450,000 square kilometres of land, almost three times the figures for America and Europe, at around 160,000 and 150,000 square kilometres respectively. South Africa is predicted to lose roughly 120,000 square kilometres, followed by Central Africa at about 75,000. By contrast, land loss in Oceania is expected to be minimal, at only around 10,000 square kilometres.
第二段 - 饼图分析
Regarding population, Asia again ranks first, with approximately 250 million people likely to be affected. South Africa follows at 117 million, despite recording only the fourth-largest loss of land. Central Africa is expected to have 95 million affected residents, exceeding America's figure of 73 million even though America is predicted to lose considerably more land. Europe presents the most striking contrast: despite ranking third for land loss, only 10 million people are forecast to be affected. Oceania records the lowest population figure, at merely 2 million.
必备语料
projected land area lost 预计损失的土地面积
population likely to be affected 可能受到影响的人口
experience the greatest impact 受到最严重的影响
record the lowest figures 录得最低数据
almost three times the figure for 几乎是……数据的三倍
rank first in both measures 在两项指标中均排名第一
present a striking contrast 呈现出显著反差
despite recording substantial land loss 尽管土地损失规模较大
the rankings do not necessarily correspond 两项排名并不完全对应